Oracle Reports Tutorial
Many colleges feature either a business intelligence course or a business intelligence degree program for those interested in learning more about data modeling.
Report Builder Features
A query builder with a visual representation of the specification of SQL statements to obtain report data
Wizards that guide you through the report design process
Default report templates and layouts that can be customized to meet your reporting needs
The ability to generate code to customize how reports will run
A Live Pre-viewer that allows you to edit report layouts in WYSIWYG mode
An integrated chart builder that helps you to graphically represent report data
Web publishing tools that dynamically generate web pages based on your data
Other standard report output formats like HTML, PDF, PCL, Postscript, and ASCII
Starting Report Builder in UNIX
Environment
Make sure PC Xware is running
Telnet your UNIX server (e.g., Pegasus by typing telnet pegasus.rutgers.edu or connect to pegasus from the SSH client (make sure X11 Tunneling is enabled in SSH preferences)
start oracle Report Builder by typing rwbld60
Using Wizards
Report Builder has a Report Wizard, Data Wizard, and Web Wizard to automate the creation of reports. Most often, you can create a report by starting with one of the wizards, and then refining the report that the wizard creates using the data model view and the layout view.
To create a report using report wizard
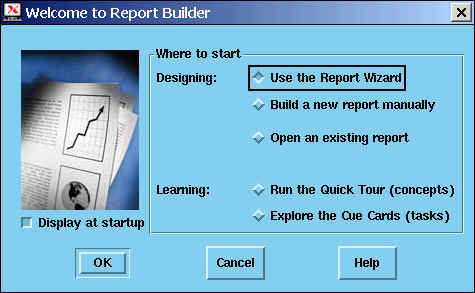
If the Welcome dialog box appears (the following screen), click Use the Report Wizard and click OK.
If the Welcome dialog box does not appear, choose File->New->Report. Click Use the Report Wizard and click OK.
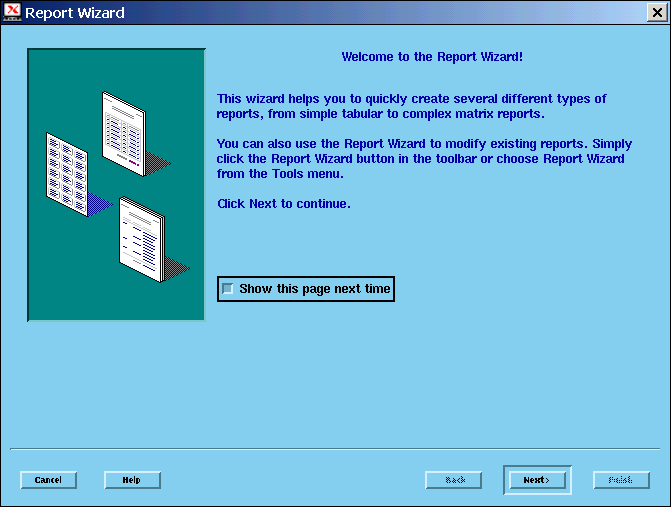
You will receive the following screen unless you selected not to display it in the future previously. Click next
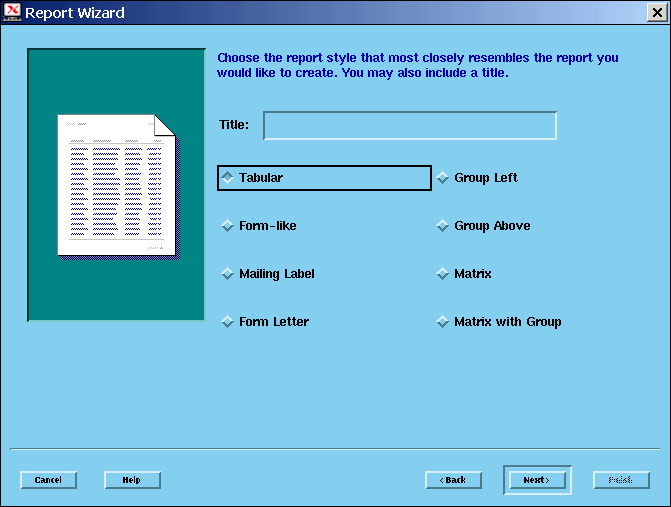
Select Report type; this will affect report layout. you can see the different layouts by clicking their corresponding buttons and looking at the sample layout on the left. After you select the type you want click next
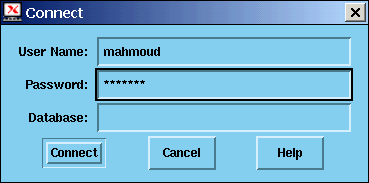
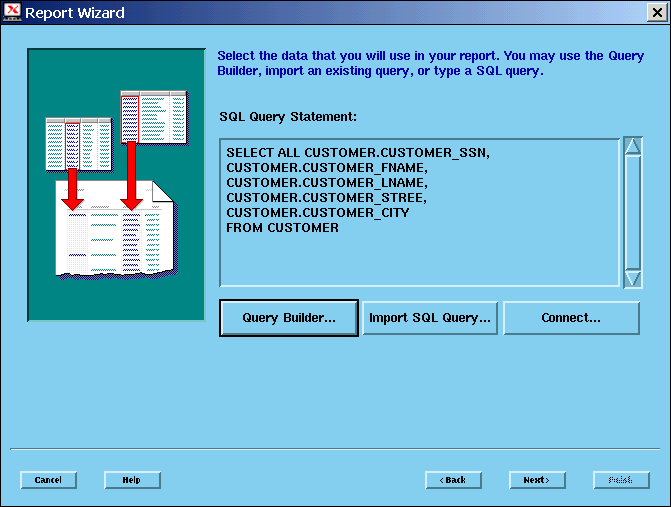
The data presented in the report is the result of a query. If you are not connected, you need to connect as shown in the following screen.You can create that query by one of three methods: (1) writing a SELECT statement (2) Building the query using the Query By Example (QBE) interface, (3) importing the query.
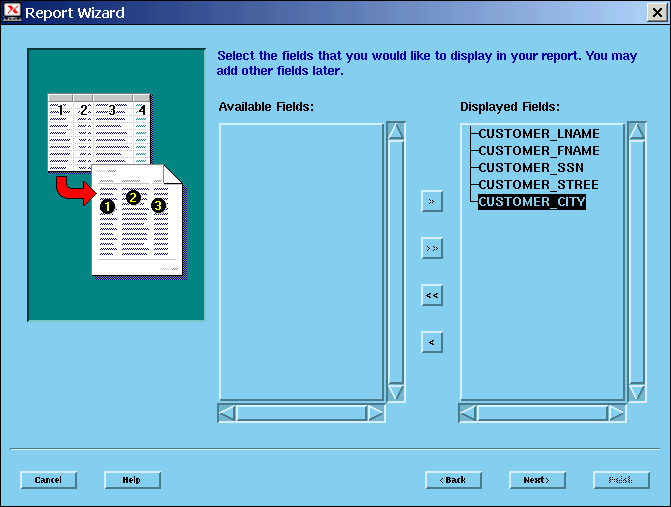
Select the fields you would like to display in the report in the order you want as shown in the next screen. Then click next
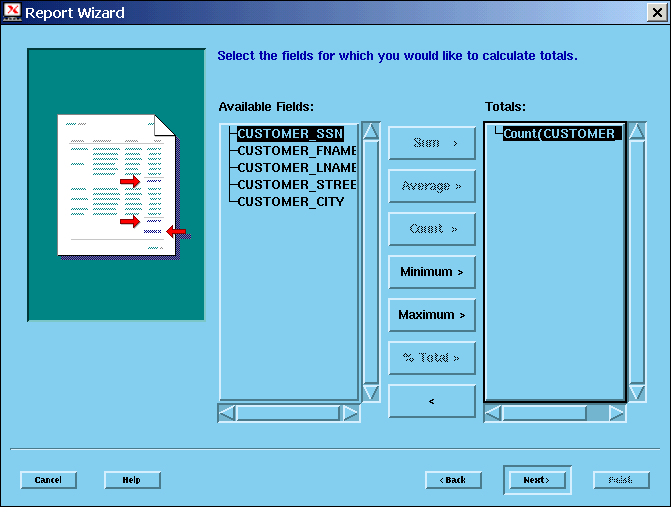
Apply aggregate functions to the fields if you want by selecting the field then the aggregate function. Then click next
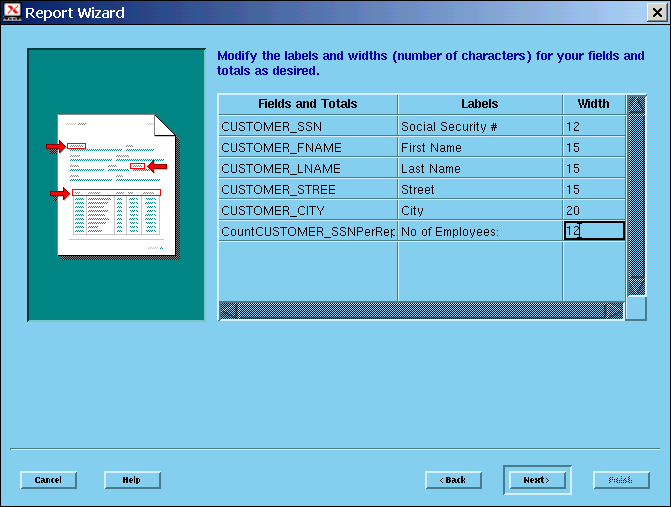
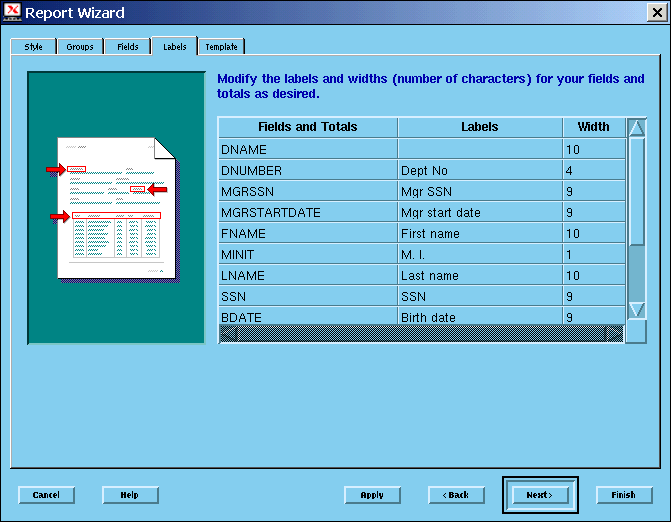
Change Field names and their width as shown in the next screen then click next
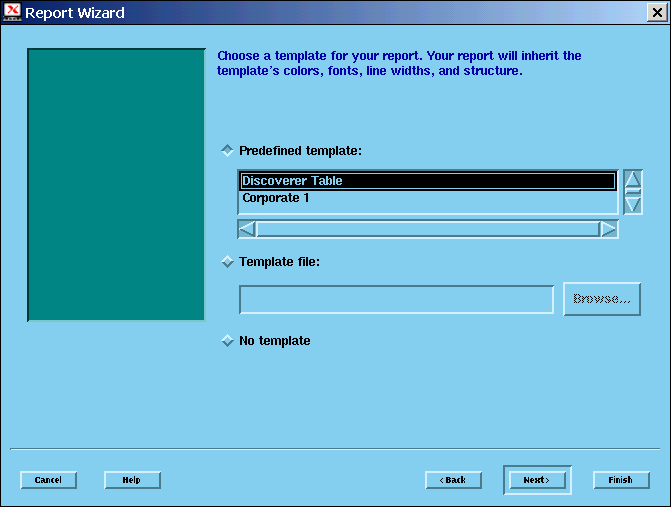
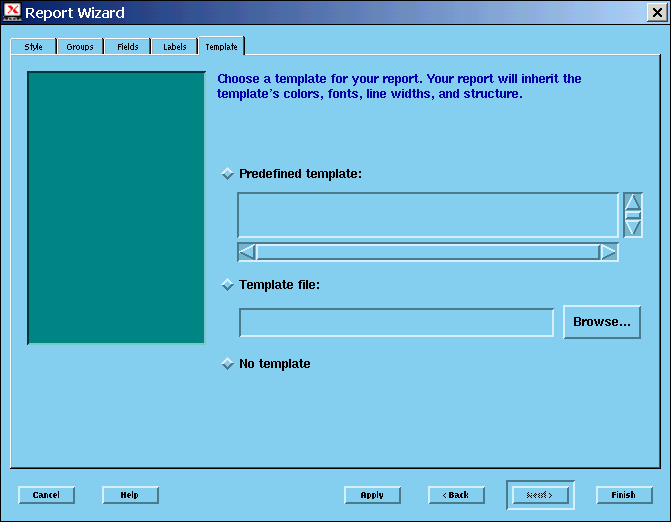
Select a template then click next
On the last page of the Report Wizard, click Finish.
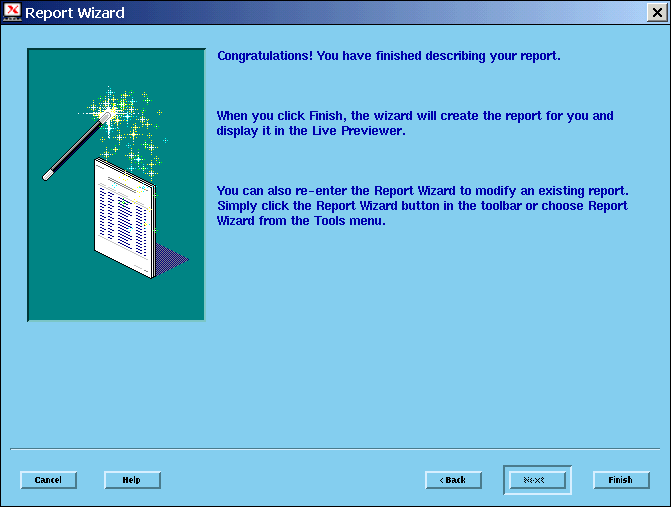
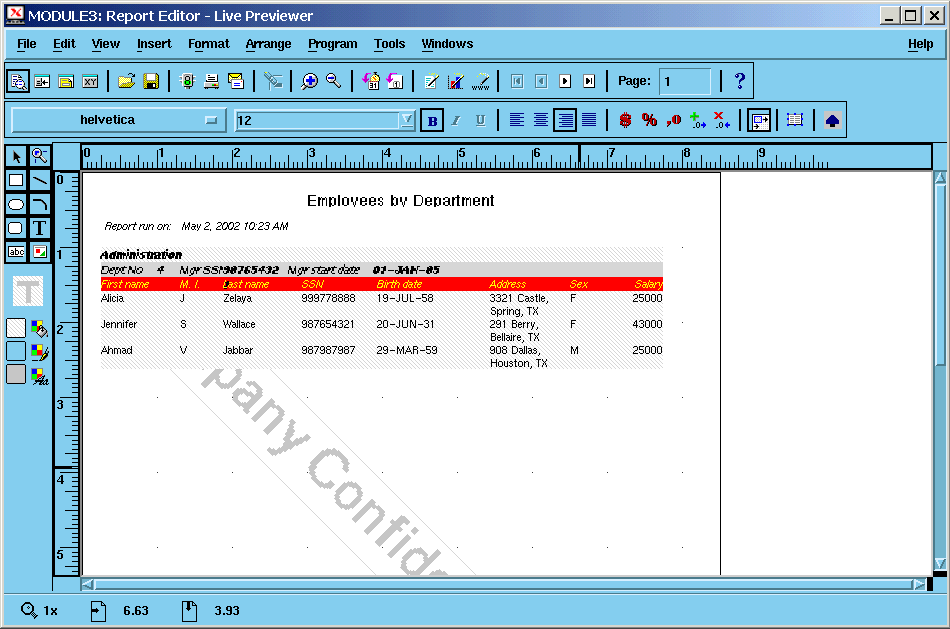
A report is created and appears in the Live Previewer.
From the Live Previewer, you can edit the report as desired. Note that the Live Previewer is one of several report views that are available in the Report Editor. Using the View menu or the toolbar, you can switch to other report views to
Report Editor
In the Report Editor, you can view information about a report in four different ways. You can switch between these views using the View menu or the toolbar icons. You will work in each of the following Report Editor views as you create the sample reports in this tutorial:
Live Previewer
Data Model view
Layout Model view
Parameter Form view
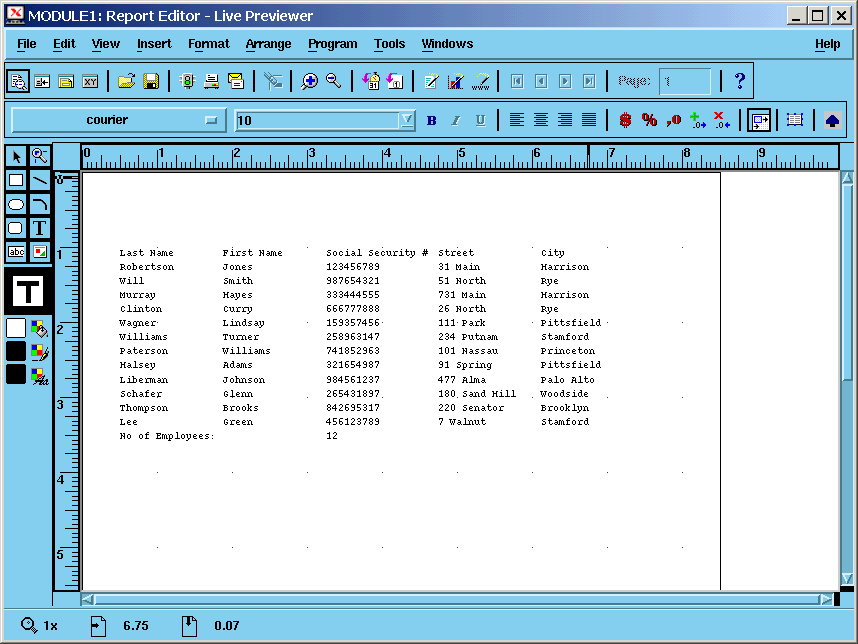
Live Previewer
This view displays your report as the end user will see it. If you are using existing data, the Live Previewer will update the report as data changes. Any modifications that you make to the report in the Live Previewer are reflected immediately. To display your report in the Live Previewer, select View menu then Live Previewer.
Data Model view
This view displays your report data as data model objects so that you can see the relationships between queries, groups, columns, parameters, and links. To display your report in the Data Model view, select View menu then select Data Model.
Layout Model view
This view displays the attributes of your report as objects so that you can see the attribute types and relationships. You can edit layout objects, such as frames, repeating frames, fields, boilerplates, anchors, and graphics in this view in order to change the appearance of the report. To display your report in the Layout Model view, select View menu then select Layout Model.
Parameter Form view
This view lets you create a Runtime Parameter Form for your report. When a user runs your report, the user enters values for parameters in this form to determine how the report will execute. Otherwise, the user may accepts the defaults. If you do not define a Runtime Parameter Form in the Parameter Form view, Report Builder displays a default Parameter Form at runtime. You can select which system and user parameters to use for your form using the Parameter Form Builder, or you can create your own from scratch. To display the Parameter Form view, select View menu then select parameter form.
Modifying Report Format
To apply changes to any column, click anywhere in that column. Report Builder will select all the rows in that column to indicate that changes will apply to all the rows. You can select multiple columns and items by holding shift and clicking on those columns or report items.
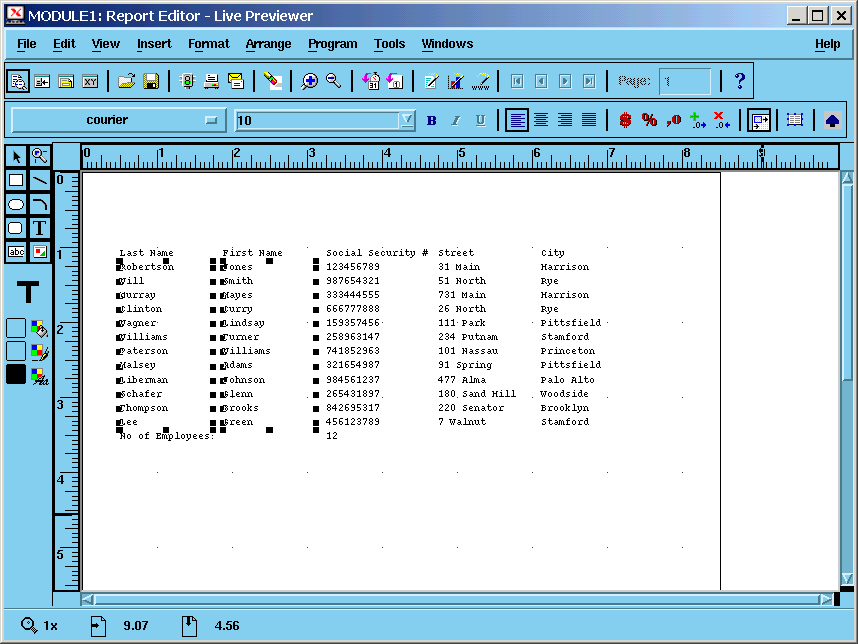
After selecting the items you want to modify, apply the required changes by selecting the appropriate icons from the formatting toolbar. As seen in the toolbar you can change font face, font size, toggle between bold/unbold, etc. You can also change data alignment (left justified, centered, right justified, full justified). For Monetary data items, yo can add dollar sign, percentage sign, increase number zeros on the right to the decimal point, etc.
![]()
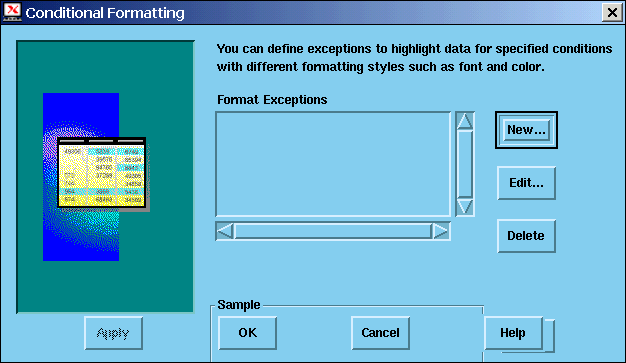
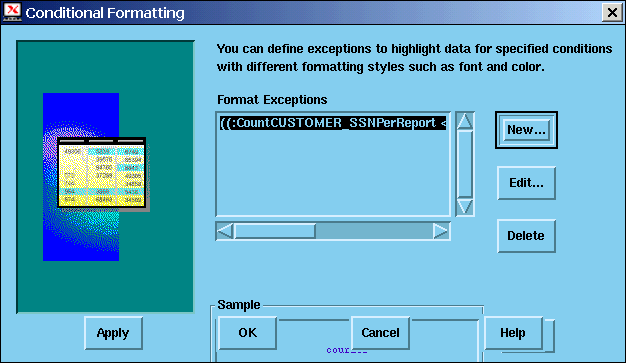
Conditional Formatting
The Conditional Formatting is a great way to apply formatting exceptions to your layout objects. (For example, you can make a field’s value Red when it exceeds a specified maximum value). If you are familiar with Excel, there is a similar feature there. The Conditional Formatting dialog box alone may satisfy your requirements for creating a formatting exception without the need to edit the corresponding trigger. However, once you directly edit a Format Trigger for an object, you should not go back and use the Conditional Formatting dialog box to make more modifications.
To apply conditional formatting to an item:
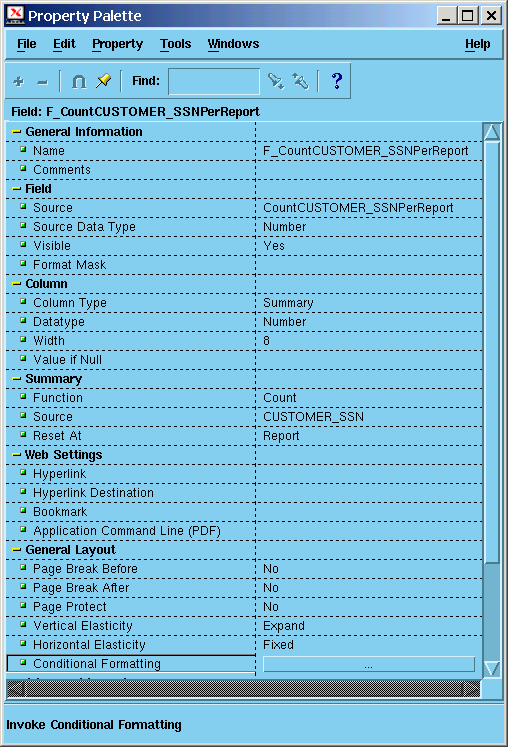
select that item, then select property palate from Tools menu. Or right click that data item and select property palate.
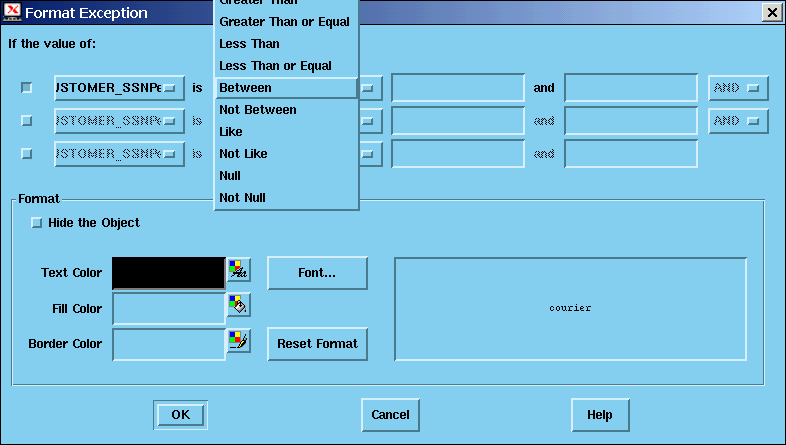
Under the general layout section, select Conditional Formatting as show in next screen. you will get the conditional formatting dialog box.
|
|
Click New
Apply a condition by selecting an operator such as Less than or Between then put the values for the condition. You can have a complex condition (multiple conditions connected by AND or OR) by clicking radio button in the next line. The AND/OR will be enabled (on the right).
Then Apply the format you want when that condition is met by changing the font face, color, fill color, etc. You can also select to hide the data item.
when you click ok you go back to the Conditional Formatting dialog box with the Format expression written in. Click Ok to exit.
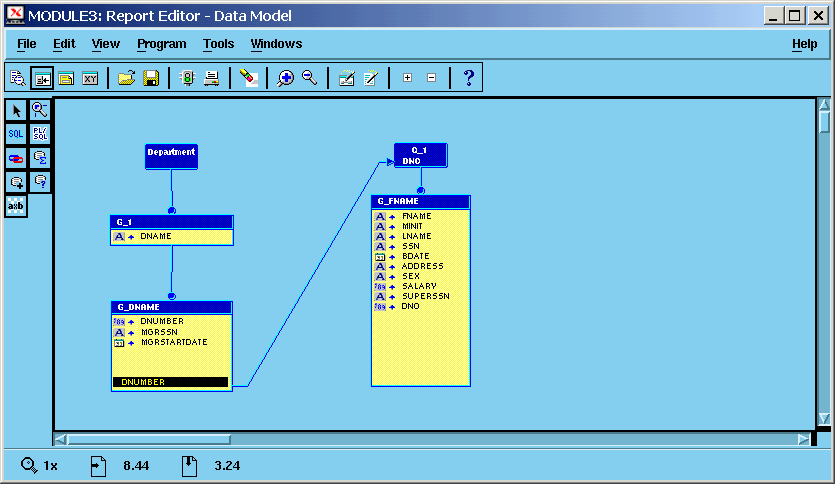
Creating Data Model
In this section you will learn how create a multiple-query data model. First, you will create two queries. Then you will create a break group for the first query. Finally, you will link the two queries.
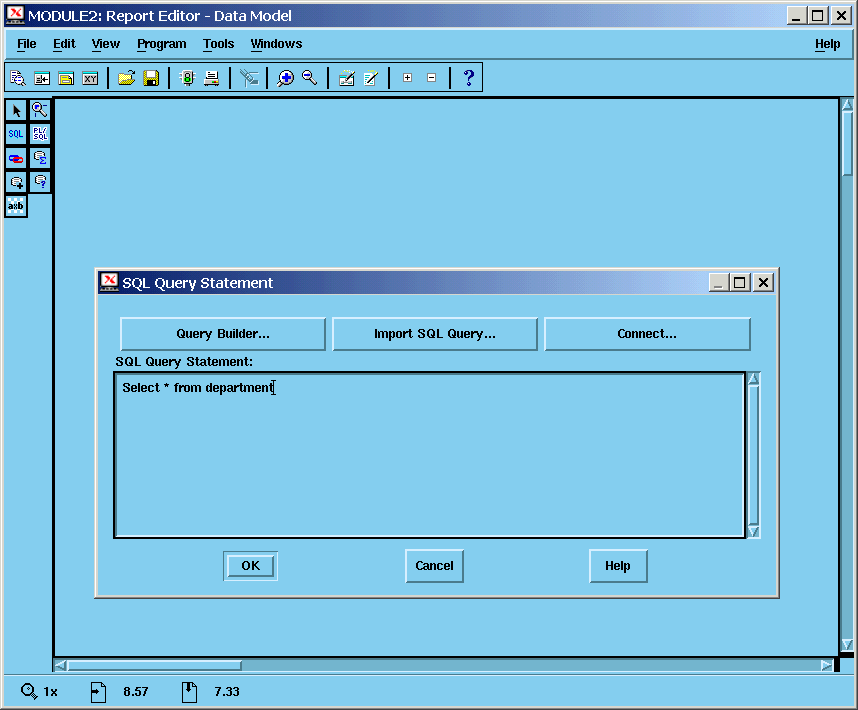
In the Data Model view, click the SQL icon (on the left) then click anywhere inside the data model screen. You will get SQL Query Statement screen as show below. Write a query or build it by the query builder or import an SQL query from an existing SQL file.
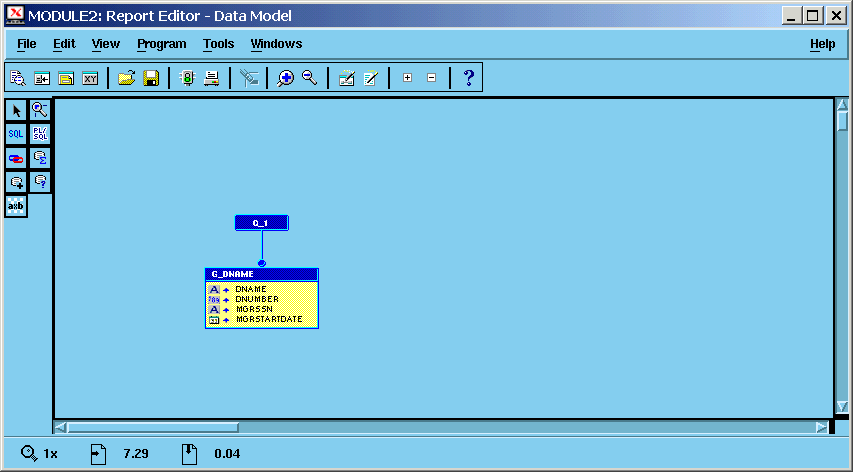
You will get the a drawing representing the query as in the next screen
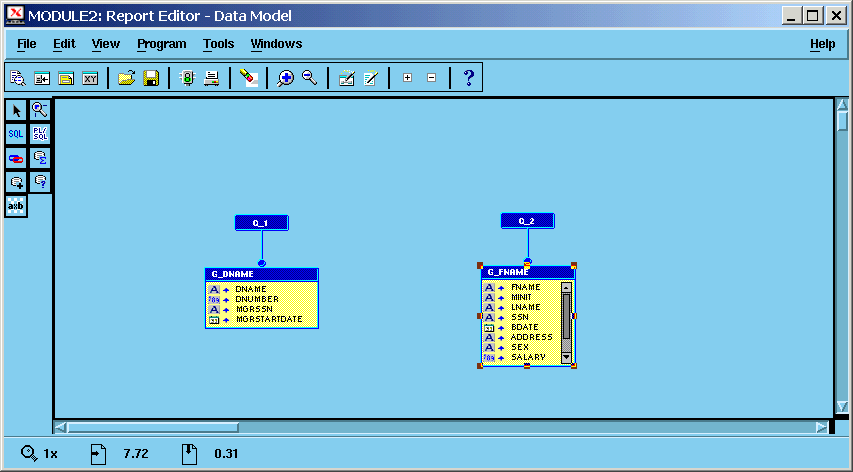
Now repeat the same steps again to build another query. Make sure to have PK / FK relation between the two tables in the two queries.
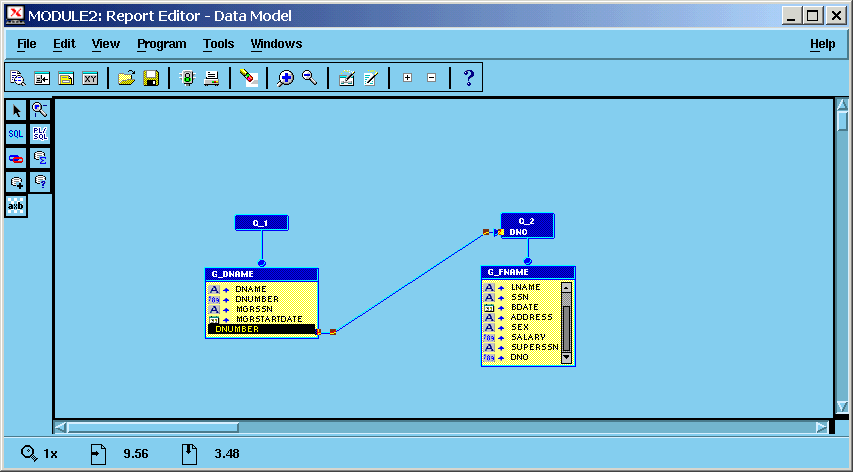
Select the link tools (two overlapping circles). Click on one of the fields in the relation and drag to the other field in of the relation in the other table. You will get the following screen.
Create a break group by dragging a field between the query name and the field list as shown below.
generate a default layout by running the report wizard from the Tools menu. You will get the first tab of the wizard (Style)
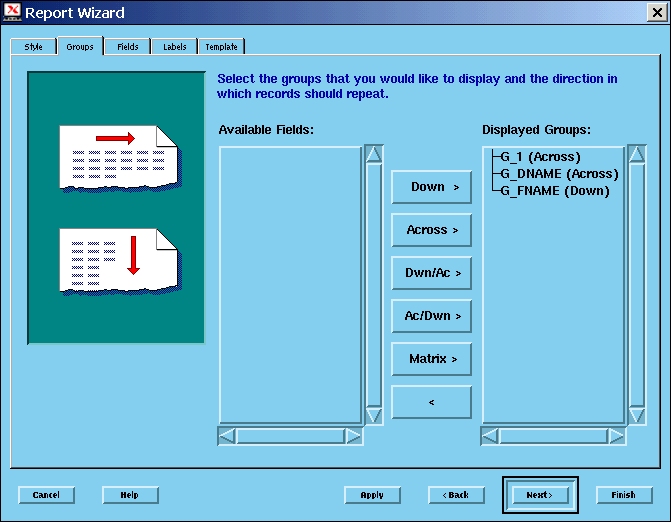
Notice that this selection is related to the way you will organize the different parts of the report. At this point you have two tables and a breaking group. Notice that they have new names (in the screen above). For example, employee is now G_FNAME. Select Group Above

In the group page select G_1 and click across, select G_DNAME and click Across, then select G_Fname and click Down. These buttons (Across, Down, etc) indicate how the report will be filled up. For example, Across means fill horizontally, down means vertically, Across/Down means horizontal then vertical
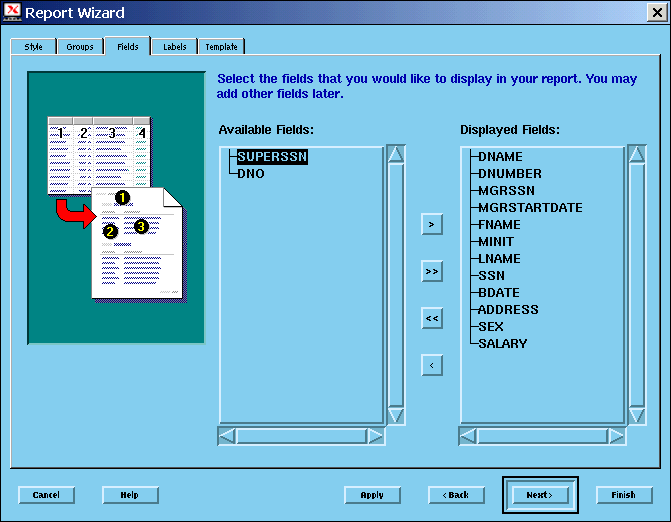
Select the field you want to display. You may not need all field if some fields are repeated such as DNO and SUPERSSN.
Select a Template. You may not get the exact list of templates and hence not the same way the report locks. Then click Finish.
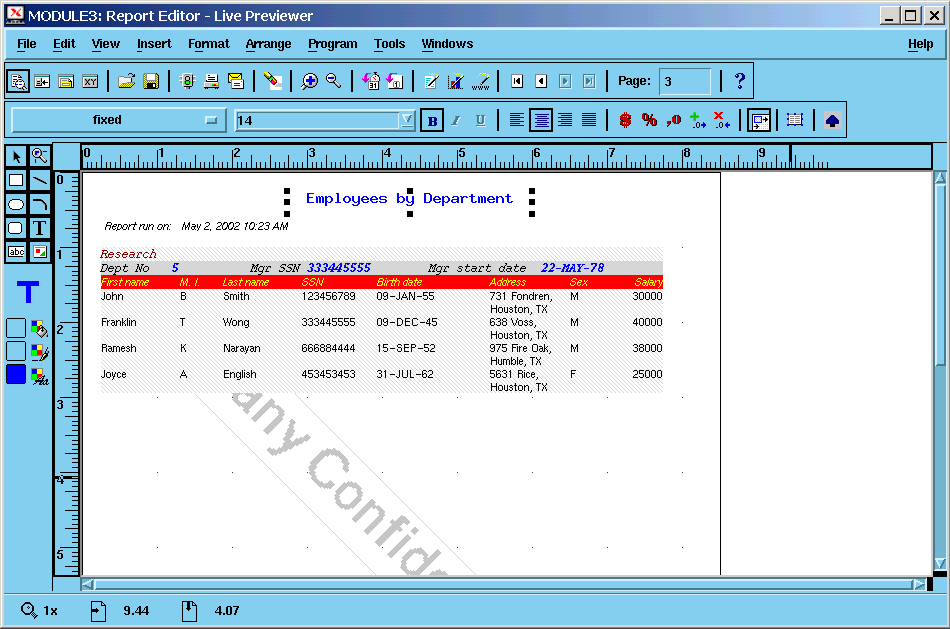
You should get something similar to this. Notice that every department shows in a separate page. You can see other pages by clicking the arrow in the toolbar or changing the page number in the toolbar also.
Now you can change formatting to lock the way you want it.
Copyright @ Mahmoud Youssef